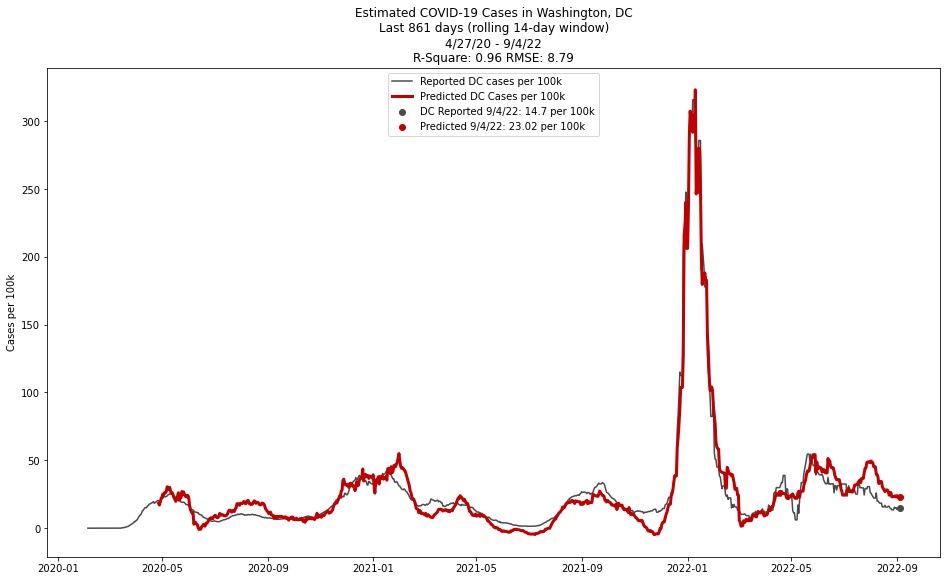
This project attempts to estimate the rolling 14-day COVID-19 case load per 100,000 people in Washington, DC. Another goal is to give a snapshot of the DC-Metro area’s COVID risk as public sources of this data become more difficult to find through conventional means (e.g. newspapers or websites) or as public health authorities scale back on their case reporting. The project was launched in response to DC announcing they would scale back their COVID reporting to once weekly.
- Fairfax County Tax Assessments
Fairfax County’s Open Data GIS system makes several large datasets covering parcels within the county available to the public. The datasets must be combined using statistical software before they can be analyzed. For this project the relevant data are included in two datasets:
- Legal data: https://data-fairfaxcountygis.opendata.arcgis.com/maps/tax-administrations-real-estate-legal-data/about
- Assessed Values: https://data-fairfaxcountygis.opendata.arcgis.com/datasets/Fairfaxcountygis::tax-administrations-real-estate-assessed-values/
These datasets are imported with irrelevant columns being dropped on import. They are then merged together using a pandas left join on the common column, PARID, which pandas auto-selects. Missing values from the assessed values columns are then dropped:
pd.merge(legal, assessments, how='left').dropna(subset=['PRITOT', 'APRTOT'])This results in a dataset with 364,691 unique parcel ids which include apraisals for 2021 (PRITOT) and 2022 (APRTOT).
Next the tax data must be fetched. This can be downloaded from the Fairfax County website in PDF form. To convert to machine-readable format the data was converted to an HTML page by Adobe Acrobat DC, then the HTML was copy/pasted into Microsoft Excel followed by some minor cleaning:
- removing multiple header columns
- TOTAL TAX label being added to blanks under ‘FUND NAME’
- converting the tax rate from percent to decimal
- water_fee being added to the few relevant areas with copy/paste
Once the data is ready for pandas in a tidy csv file, it can be imported and the tax rate column filled in using drop_duplicates to isolate the tax rate, then a merge to fill in the blanks on the main dataset. This also has to be done for the refuse fee and those districts who do not have additional fees need to have refuse fee and water fee filled with zeros.
To find the total tax for the database, multiply the APRTOT by 2022 tax and add water fee and refuse fee columns, then do the same for 2021 and PRITOT. Then column-wise summations and other calculations can be made.
Property Taxes for all of Fairfax County:
2022: $3,798,869,215.82
2021: $3,596,410,513.71
difference: $202,458,702.12
Percent change: 5.63%
The county collected about $3.8 billion in 2022, compared with $3.6 billion in 2021. An increase of 5.63%.
- COVID Tracker Prediction 9/6/2022
The multiple linear regression model has been trained on local jurisdiction case data and used to predict the levels of DC COVID case numbers per 100,000 as a target variable. To predict yesterday’s COVID level in DC, the model needs to have the local areas’ data.
Fortunately, the NYTimes usually updates these numbers early in the day (typically DC reports their numbers around 1pm eastern):

The model easily makes a prediction for 9/6 numbers in DC using the .predict() method in statsmodels:
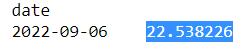
The actual DC numbers for 9/6 are:
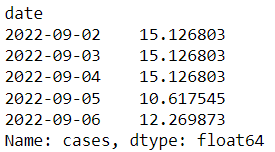
The model is off by almost 10 cases per 100,000 people. Not a great error. Next step will be to explore other machine learning methods, starting with a simple and interpretable model, the decision tree.
- Linear Regression
The multiple linear regression estimator grabs COVID case loads from several surrounding jurisdictions from the New York Times GitHub page for their COVID tracker. Population estimates were gathered manually from the Census Bureau:
- Fairfax, Virginia: 1,150,309
- Montgomery, Maryland: 1,051,000
- Prince George’s, Maryland: 909,327
- Falls Church city, Virginia: 14,658
- Arlington, Virginia: 232,965
- Prince William, Virginia: 470,335
- Loudoun, Virginia: 413,538
- Alexandria city, Virginia: 160,505
- Charles, Maryland: 166,617
- Anne Arundel, Maryland: 579,234
The tracker also grabs DC-specific caseloads from the CDC API endpoint for state data for the target variable of the regression estimate.
The raw case numbers are cumulative, and need to be transformed into per 100k rolling daily case numbers by the following steps:
- pandas .shift(1) function
- pandas .rolling(14).mean() divided by locale population, multiplied by 100,000
The ten locales are then used as the matrix for estimating in a multiple linear regression using the statsmodels package in Python with an added constant term. The target (y) variable is the actual reported cases from DC obtained through the same transformation as above.
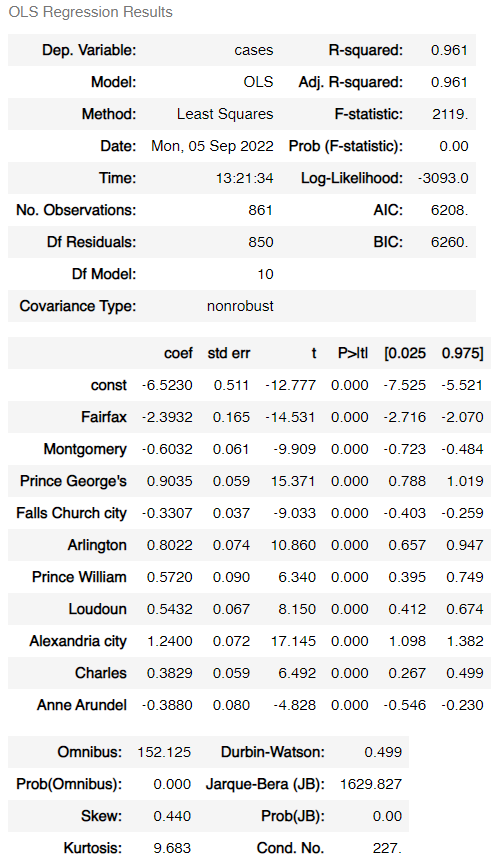
Two statistics are used for measurement: R2 and root mean squared error. The R2 statistic has been >.95 since the project began, indicating high correlation between estimated and actual COVID values. RMSE has been around 8.75 since the project began, which can be interpreted as meaning that the estimator is usually accurate to within about 8.75 cases per 100,000.