The multiple linear regression estimator grabs COVID case loads from several surrounding jurisdictions from the New York Times GitHub page for their COVID tracker. Population estimates were gathered manually from the Census Bureau:
- Fairfax, Virginia: 1,150,309
- Montgomery, Maryland: 1,051,000
- Prince George’s, Maryland: 909,327
- Falls Church city, Virginia: 14,658
- Arlington, Virginia: 232,965
- Prince William, Virginia: 470,335
- Loudoun, Virginia: 413,538
- Alexandria city, Virginia: 160,505
- Charles, Maryland: 166,617
- Anne Arundel, Maryland: 579,234
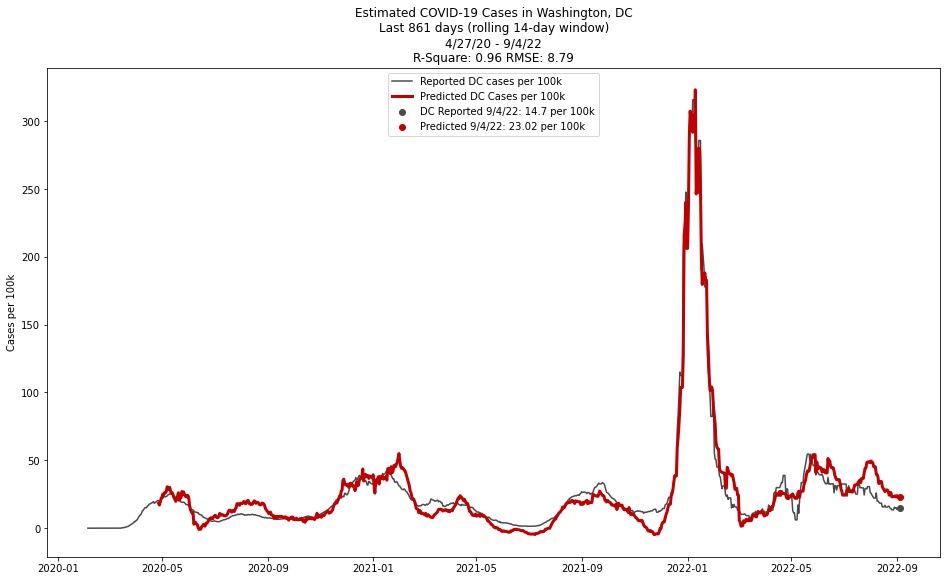
The tracker also grabs DC-specific caseloads from the CDC API endpoint for state data for the target variable of the regression estimate.
The raw case numbers are cumulative, and need to be transformed into per 100k rolling daily case numbers by the following steps:
- pandas .shift(1) function
- pandas .rolling(14).mean() divided by locale population, multiplied by 100,000
The ten locales are then used as the matrix for estimating in a multiple linear regression using the statsmodels package in Python with an added constant term. The target (y) variable is the actual reported cases from DC obtained through the same transformation as above.
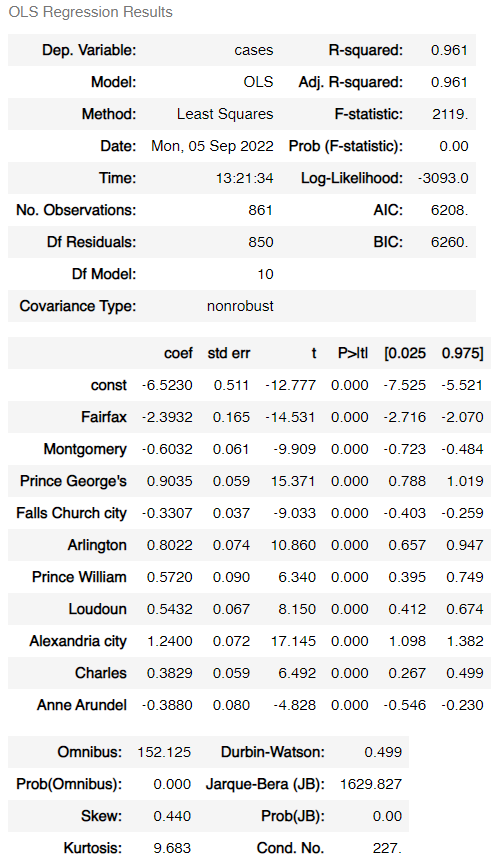
Two statistics are used for measurement: R2 and root mean squared error. The R2 statistic has been >.95 since the project began, indicating high correlation between estimated and actual COVID values. RMSE has been around 8.75 since the project began, which can be interpreted as meaning that the estimator is usually accurate to within about 8.75 cases per 100,000.