Given the distribution of gender ratio by race, and documented social determinants of female bias in gender ratios amongst Black populations, can this effect be quantified in the DC data?
The ACS data includes columns for Black population. We can engineer a ‘% Black’ column by dividing by Total Population. Looking at the percentage of Black people for a given census tract, we can try to assess what effect that percentage has on the percentage of women in that same tract. We hypothesize that as the Black population percentage increases, there will be a corresponding increase in the percentage of females in that tract.
A Python statistical package, statsmodels, and a standard ordinary least-squares linear regression model gives the following regression summary:
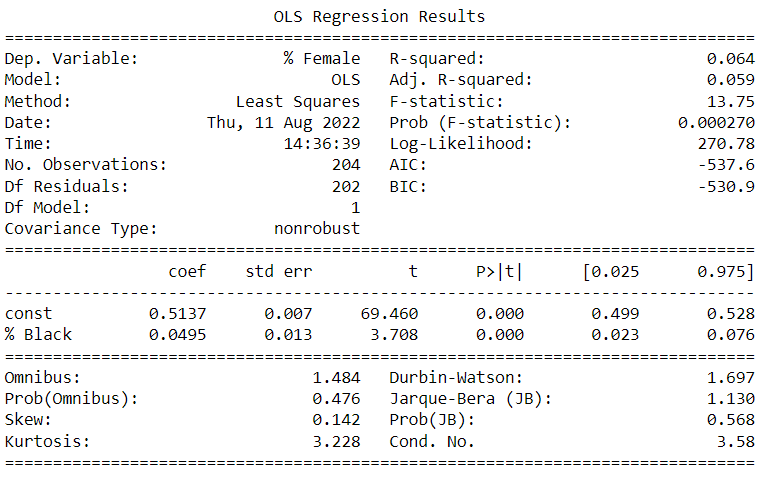
The R-square of 0.064 implies a correlation of .25 with a high level of statistical significance (f<0.05). The regression coefficient of 0.0495 implies that for every percent increase in the Black population, female population percentage increases by 0.0495. Not a huge amount, but still significant (p<0.001).
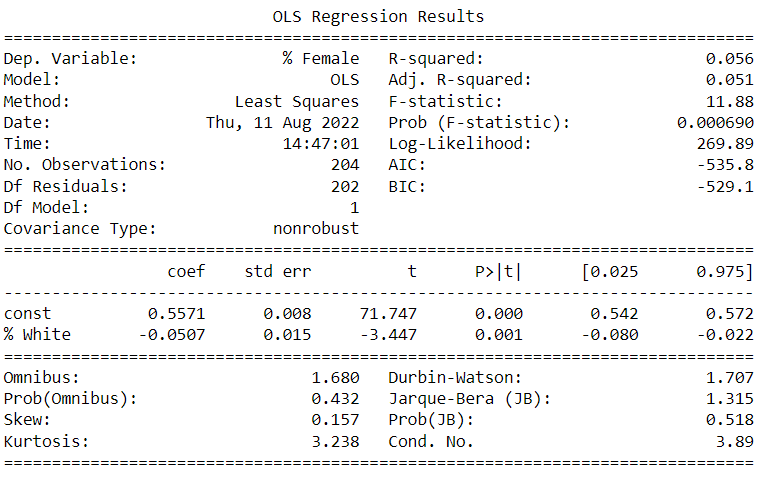
Whiter populations exhibit an opposite trend line with a negative regression coefficient, implying that as census tract populations become more White, their female population decreases relative to other tracts in DC.