I looked into housing price data in Fairfax County by low, medium and high density. I also look into housing construction and housing stock by density. The county tends to suffer from a lack of medium zoning. This is referred to by urbanists as the “missing middle” and consists of multifamily duplexes, cottage courts and multiplexes. These types of developments are meant to meet demand for walkable neighborhoods and affordability for certain populations. Fairfax and suburban Washington has long identified as a bedroom community for commuters, although the shift away from daily office work and the rise of singles and couples opting not to have children may increase demand for medium density housing in the future.
The county makes parcel data and other information available on their open data site. I formed the data for this analysis by merging several of these datasets along the PARID (parcel id) variable. This is a unique identifier for most properties in the county. The ZONING_DESC column in the Parcels Data file lists a particular parcel’s zoning. Fans of SimCity who examine this column will recognize broad categories of residential, commercial, industrial along with many others.
The subject of this analysis, residential parcels, are listed in the zoning column by their number of dwelling units per acre as well as some other criteria. I grouped all residential into the following categories (assumptions have to be made; these buckets are open to debate):
- Low density includes those parcels zoned for three dwellings per acre (R-3) and sparser
- Medium density includes four dwellings per acre (R-4) up to sixteen per acre (R-16)
- High density includes twenty dwellings per acre (R-20) and denser
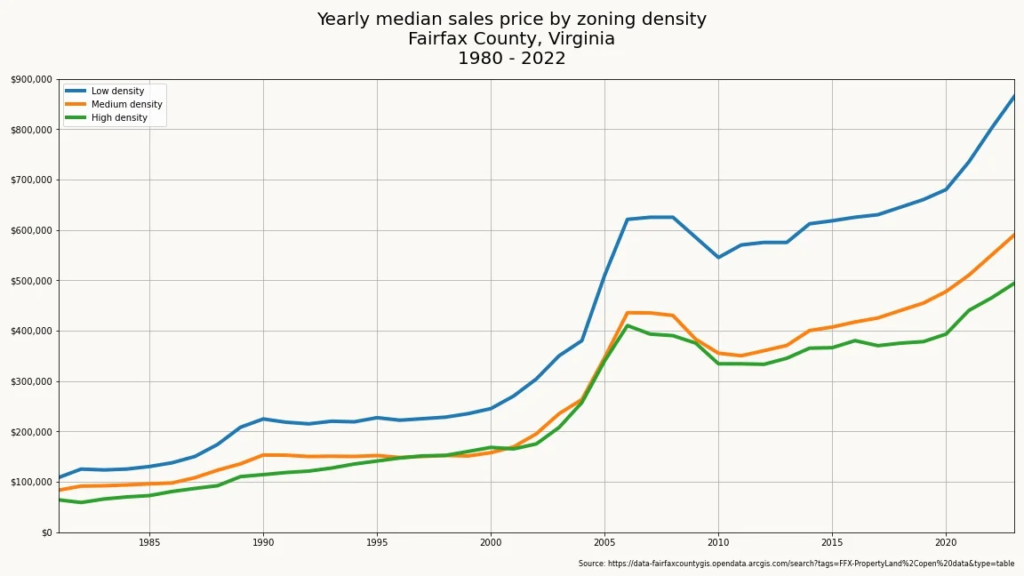
Merging these values with the county’s record of sales shows that low density parcels are significantly higher in median sales price over time, which is unsurprising. The lookback period I chose was from 1980-2022 and these figures are not inflation adjusted:
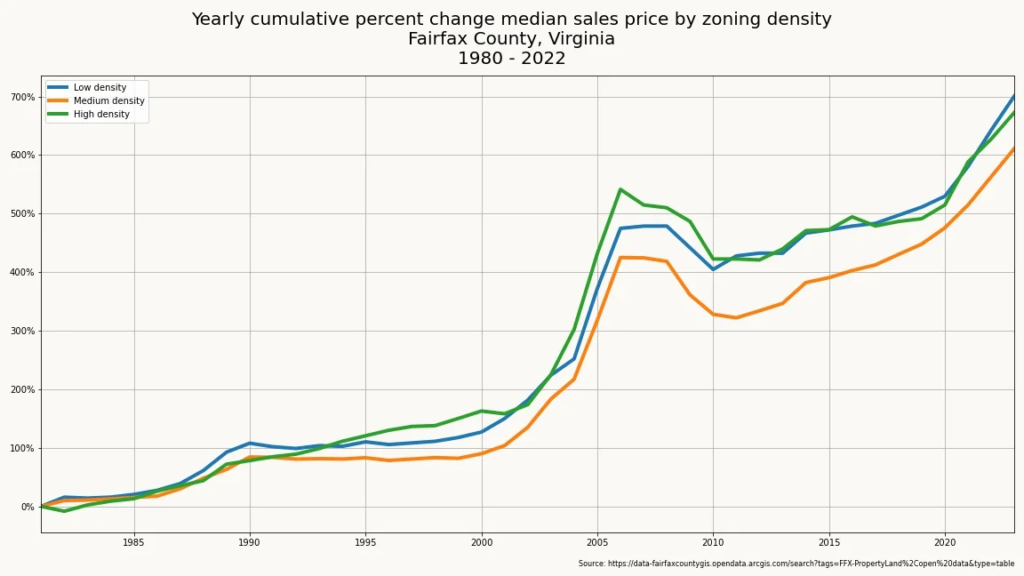
Over that time interval, low density properties have performed the best on a percentage basis, returning more than 700% in median value, while high density properties were close behind returning 672%. Medium density returned 611%:
What’s driving these trends? First is that Fairfax is a desirable place to live and thus there is a lot of demand for housing. Second, there is limited supply, as evidenced in the data.
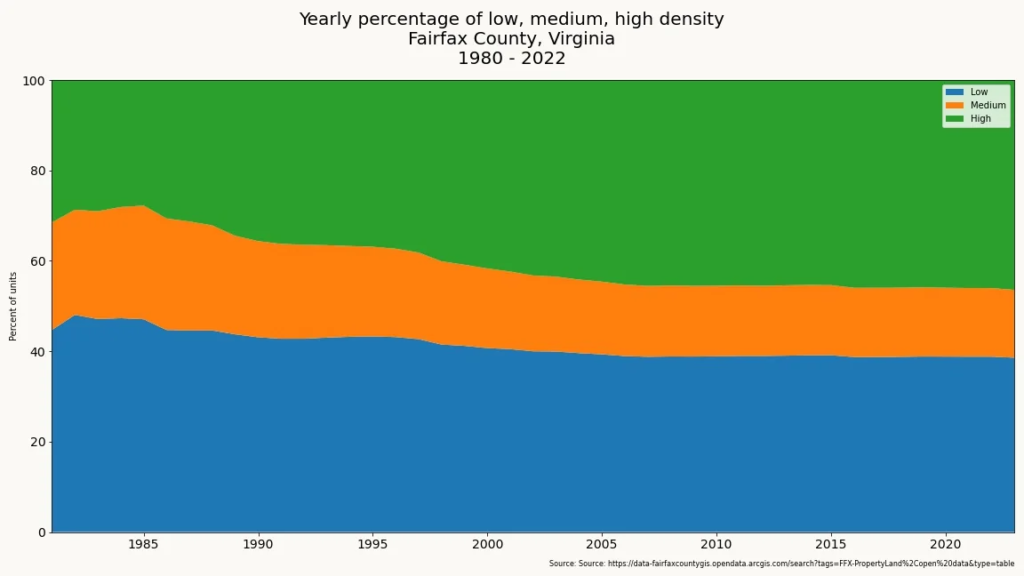
Looking at the cumulative change since 1980, the county started with 45% low, 24% medium and 31% high density housing. In 2022 it was low 39%, medium 15%, high 46%. I have tried to be as inclusive of rental units as possible since the data for these are provided in the commercial dataset available on the county website. My summary should be considered approximate, not definitive:
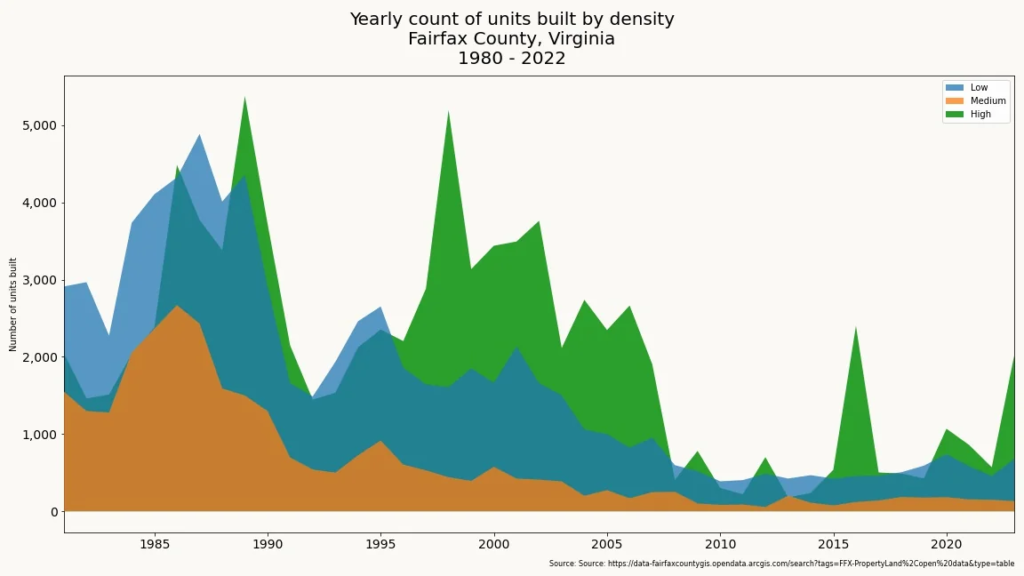
New construction has fallen off recently. There are spikes of high activity, but none reaching early 2000s or 1980s-era numbers, at least since the subprime crisis:
The county has made efforts to reform the old zoning code, first implemented in 1978. Earlier this year the Virginia Supreme Court invalidated the ratification of the updated zoning regulations (called ZMOD), due to the virtual nature of the board of supervisors’ 2021 vote. The BoS has more recently re-adopted the updated zoning regulations this year. You can read the 691-page document here: https://www.fairfaxcounty.gov/planning-development/sites/planning-development/files/assets/documents/zmod/zmod-adopted-ordinance-footnotes.pdf.